Automated Reporting & Data Pipeline Development for Large-Scale Observational Datasets
Overview:
Led a data transformation initiative within a federal research agency to improve the usability and impact of large-scale observational datasets. Historically, the program maintained large archives of raw, unstructured data that limited reuse and insight generation.
Leadership prioritized surfacing key patterns and metrics through automated reporting solutions to better communicate program value and improve data accessibility.
Key Contributions and Outcomes:
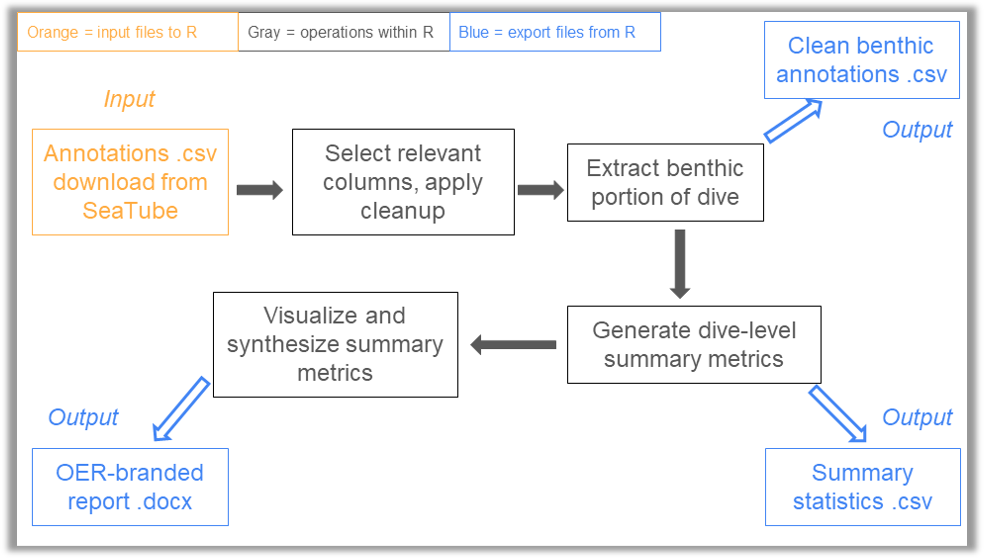
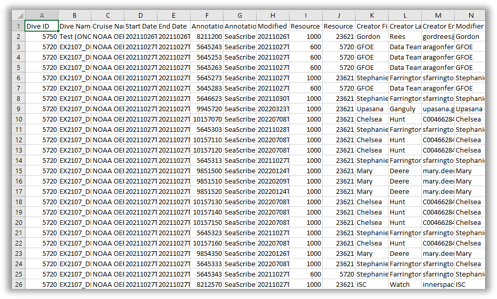
Developed data pipelines in R to clean, organize, and structure over 80,000 annotations from archival video data, enhancing the dataset's usability across internal and external partners.
Automated data extraction by building custom web scraping and data integration scripts to combine technical operations data with observational records, enabling cross-referencing and analysis across time periods and missions.
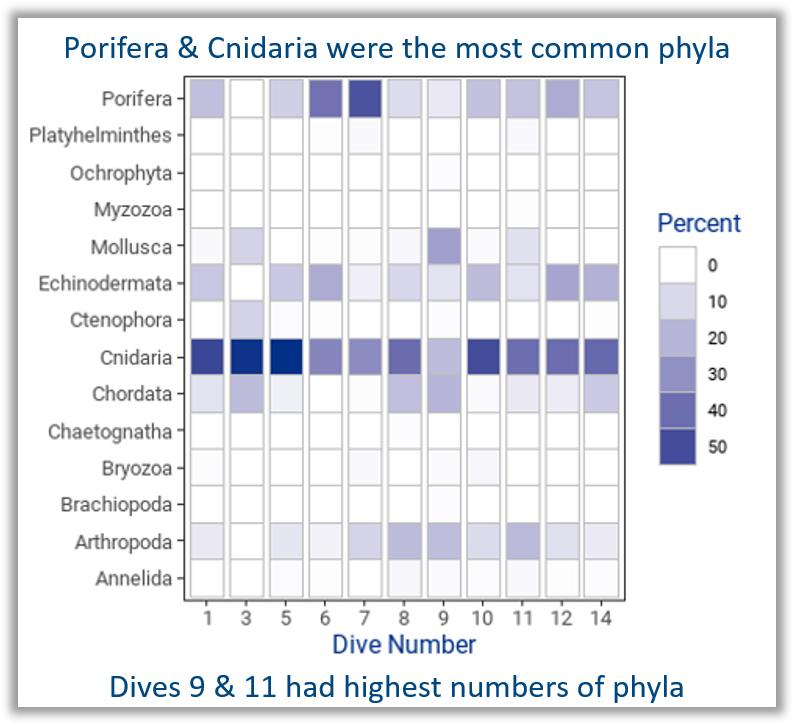
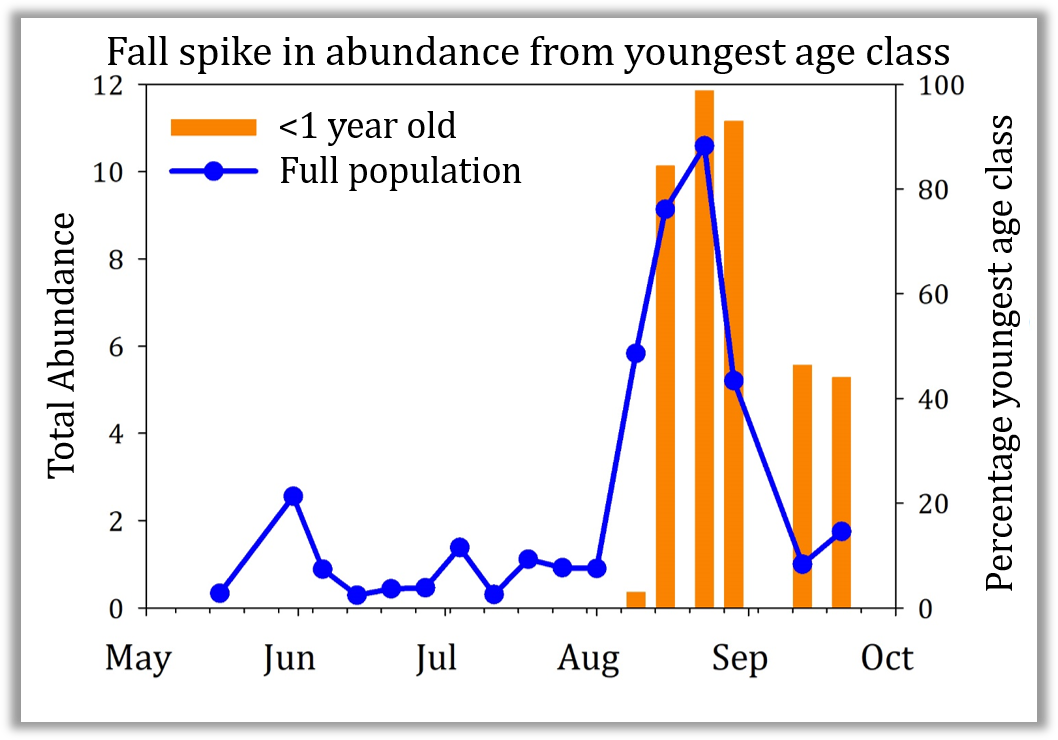
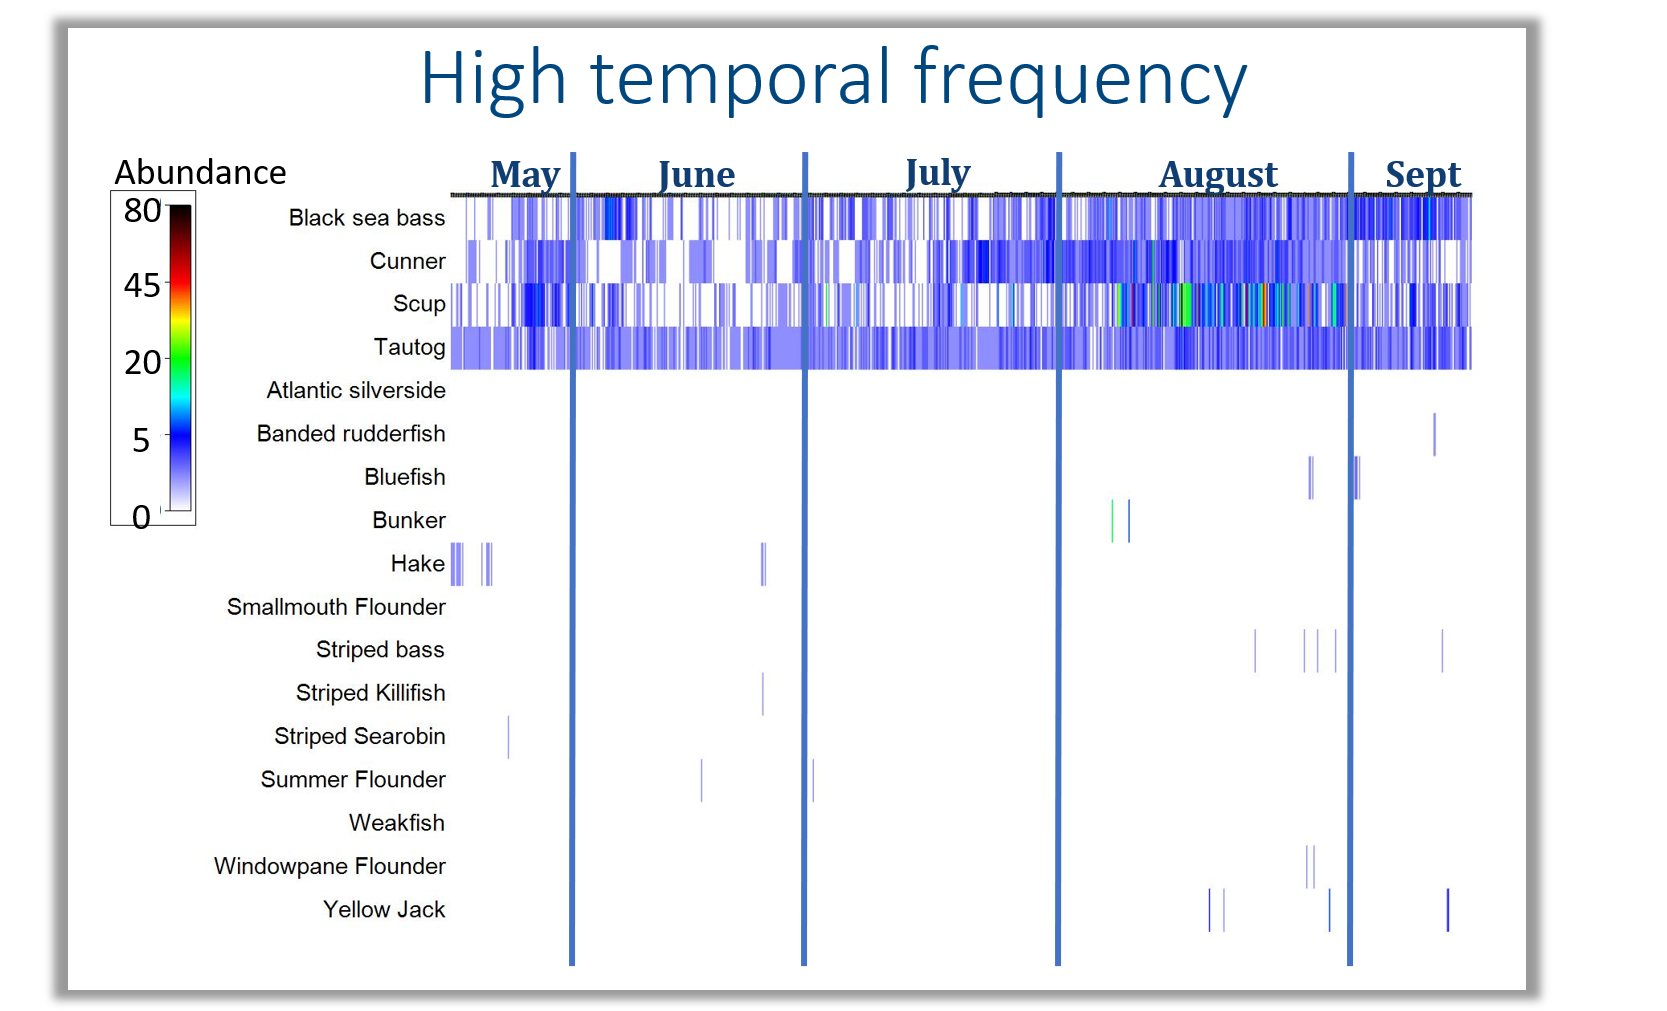
Defined 16 core performance metrics in collaboration with subject matter experts to ensuring reporting outputs aligned with stakeholder priorities around spatial and temporal variation in observational data.
Created a dynamic reporting tool using Quarto to automate generation of branded data visualizations and summary reports, reducing time spent on manual analysis, and allowing internal and external data users to easily compare performance metrics across missions and identify datasets that warrant more in-depth analysis.
Applied the reporting solution across multi-year historical datasets (2017-2022), identifying opportunities for improved data standardization and boosting data discoverability through the publication of accessible summary reports.
All of my code is publicly available on GitHub.
Skills & Technologies:
R Programming | ETL & Data Pipeline Design | Data Visualization | Automated Reporting | Version Control & Open Source Collaboration

Data Analytics Tool for Regulatory Decision-Making


Overview:
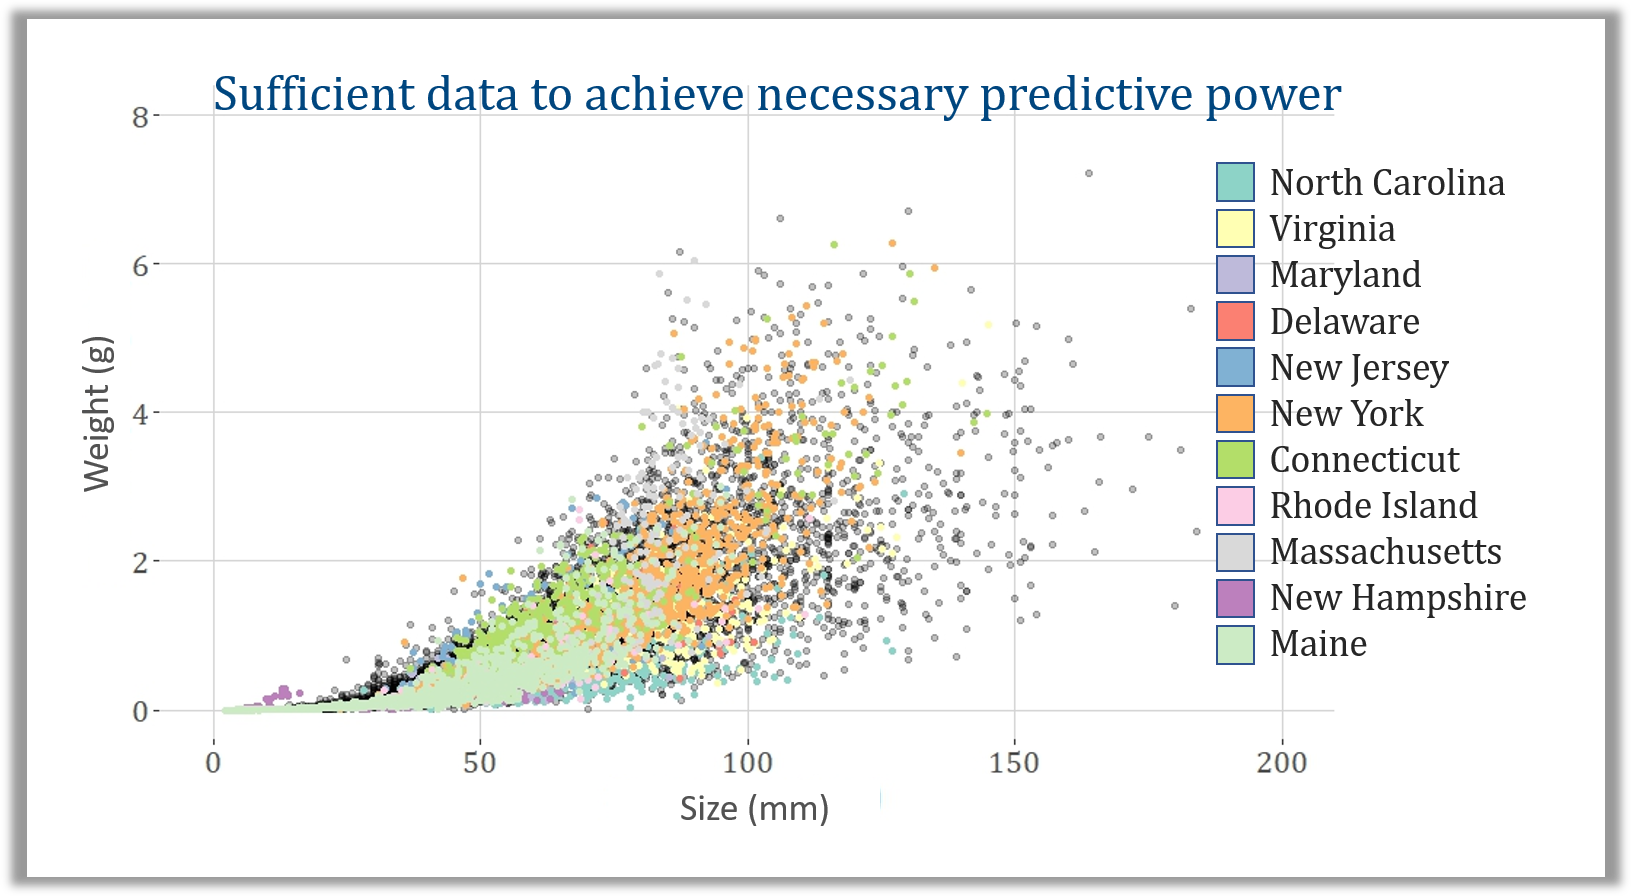
Spearheaded the development of a user-friendly, data-driven analytics tool designed to support regulatory evaluations by quantifying project-level benefits through streamlined inputs. The tool enables evidence-based decision-making while balancing stakeholder interests, and has been adopted by regulatory bodies and industry professionals across a multi-state region.
Key Contributions and Outcomes:
Led a cross-institutional collaboration to curate and publish key performance data in an open-access format, improving transparency and enabling independent validation by external reviewers.
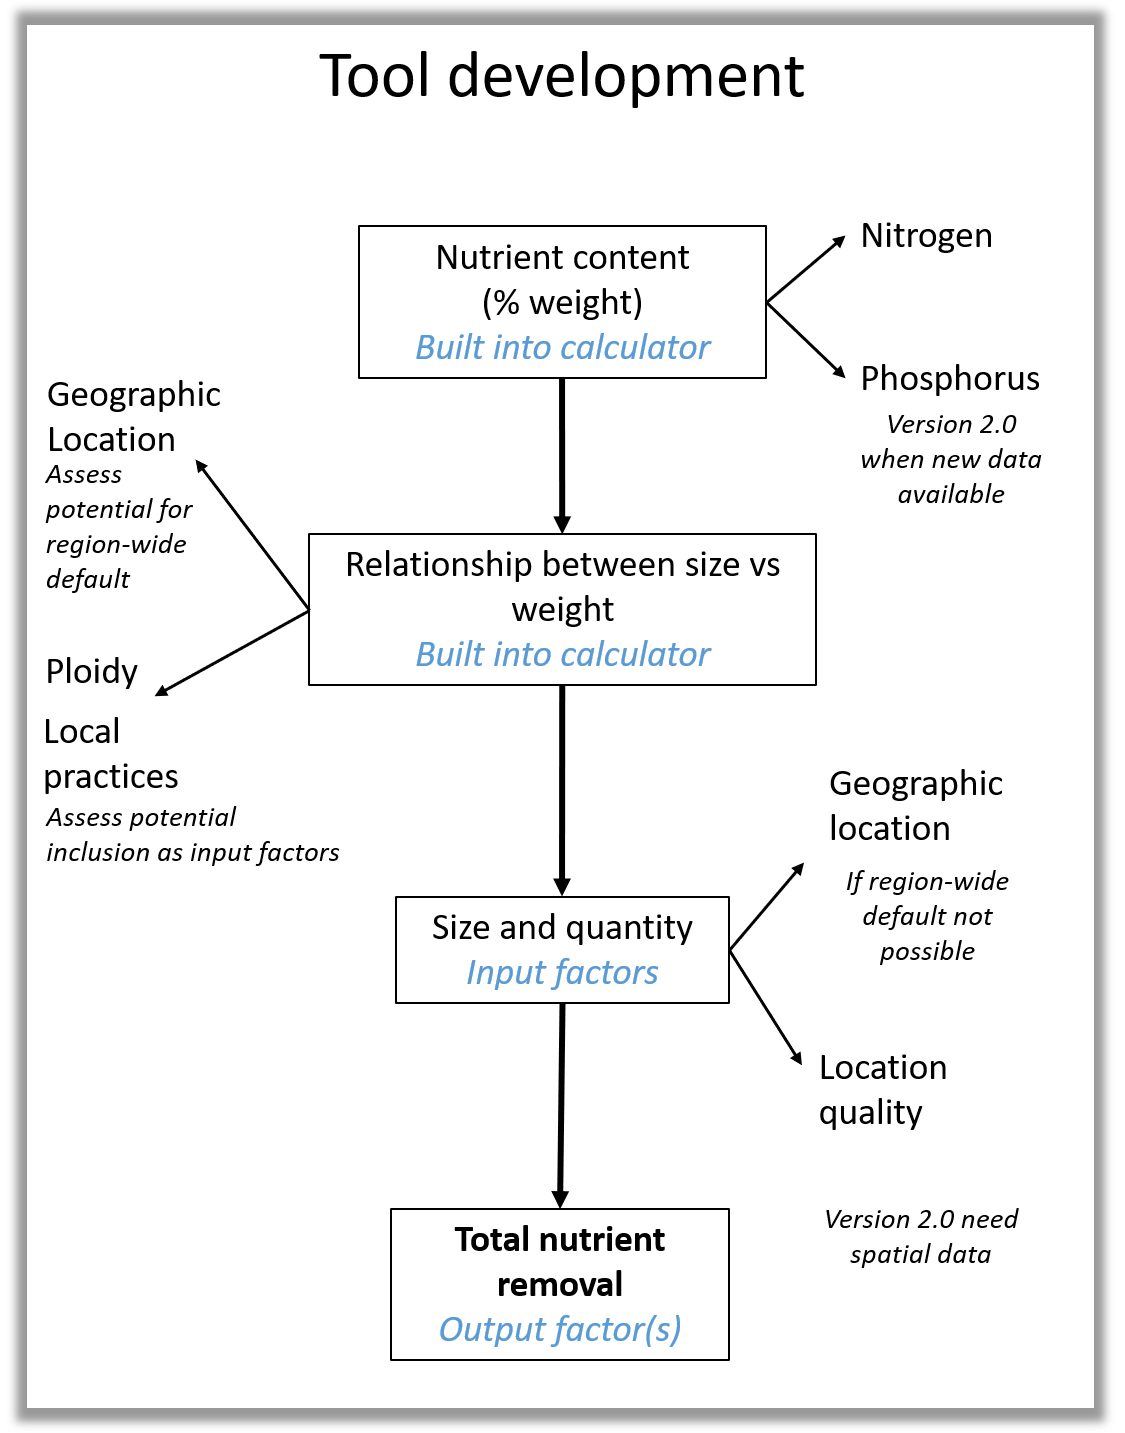
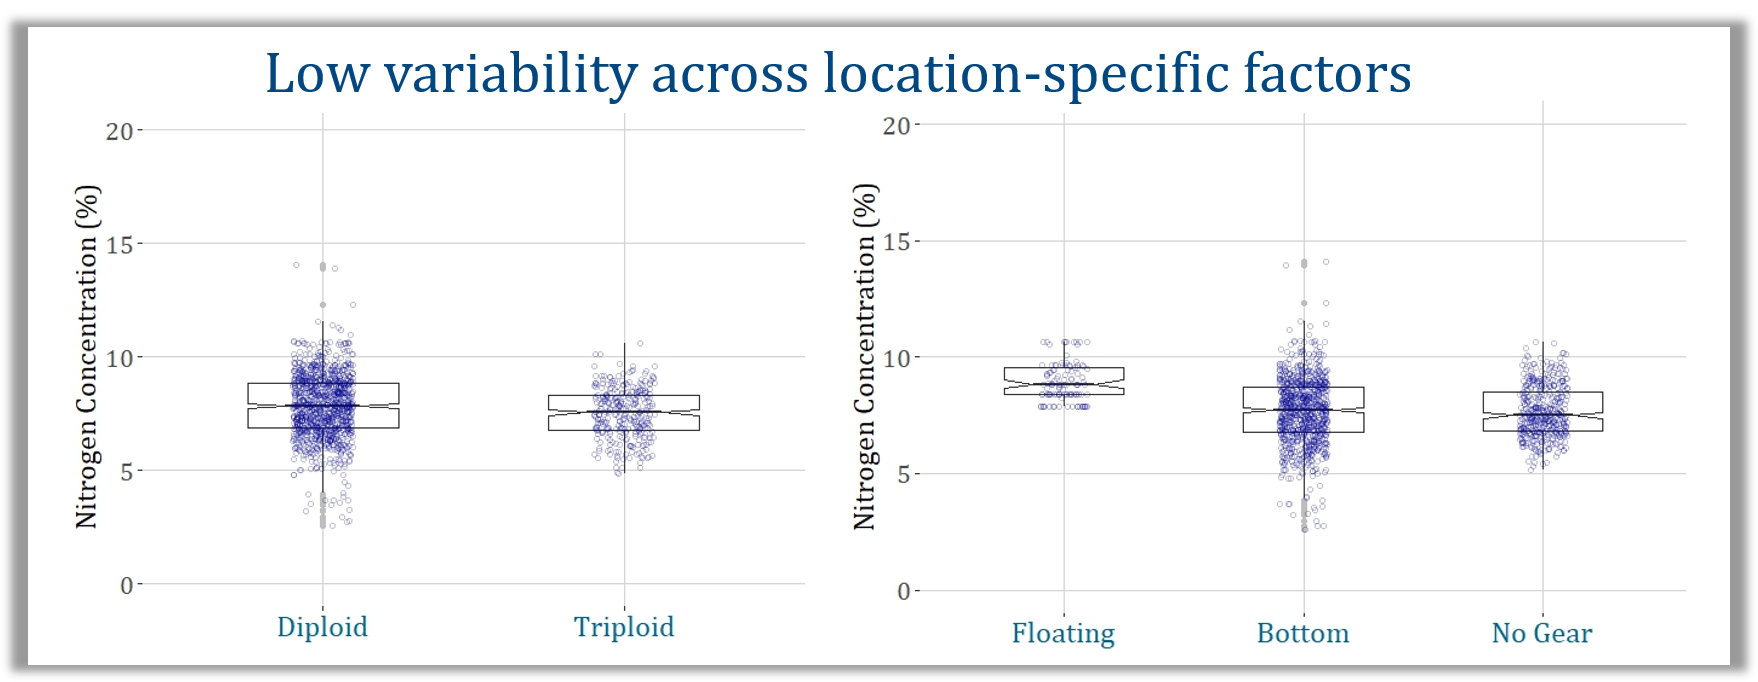
Conducted advanced statistical analysis in R, including nonlinear quantile regression and bootstrap-based hypothesis testing, to identify a minimal input set capable of producing accurate benefit estimates.
Oversaw full-cycle tool development, from data modeling to UI/UX feedback integration, coordinating work across programming, research communications, and design.
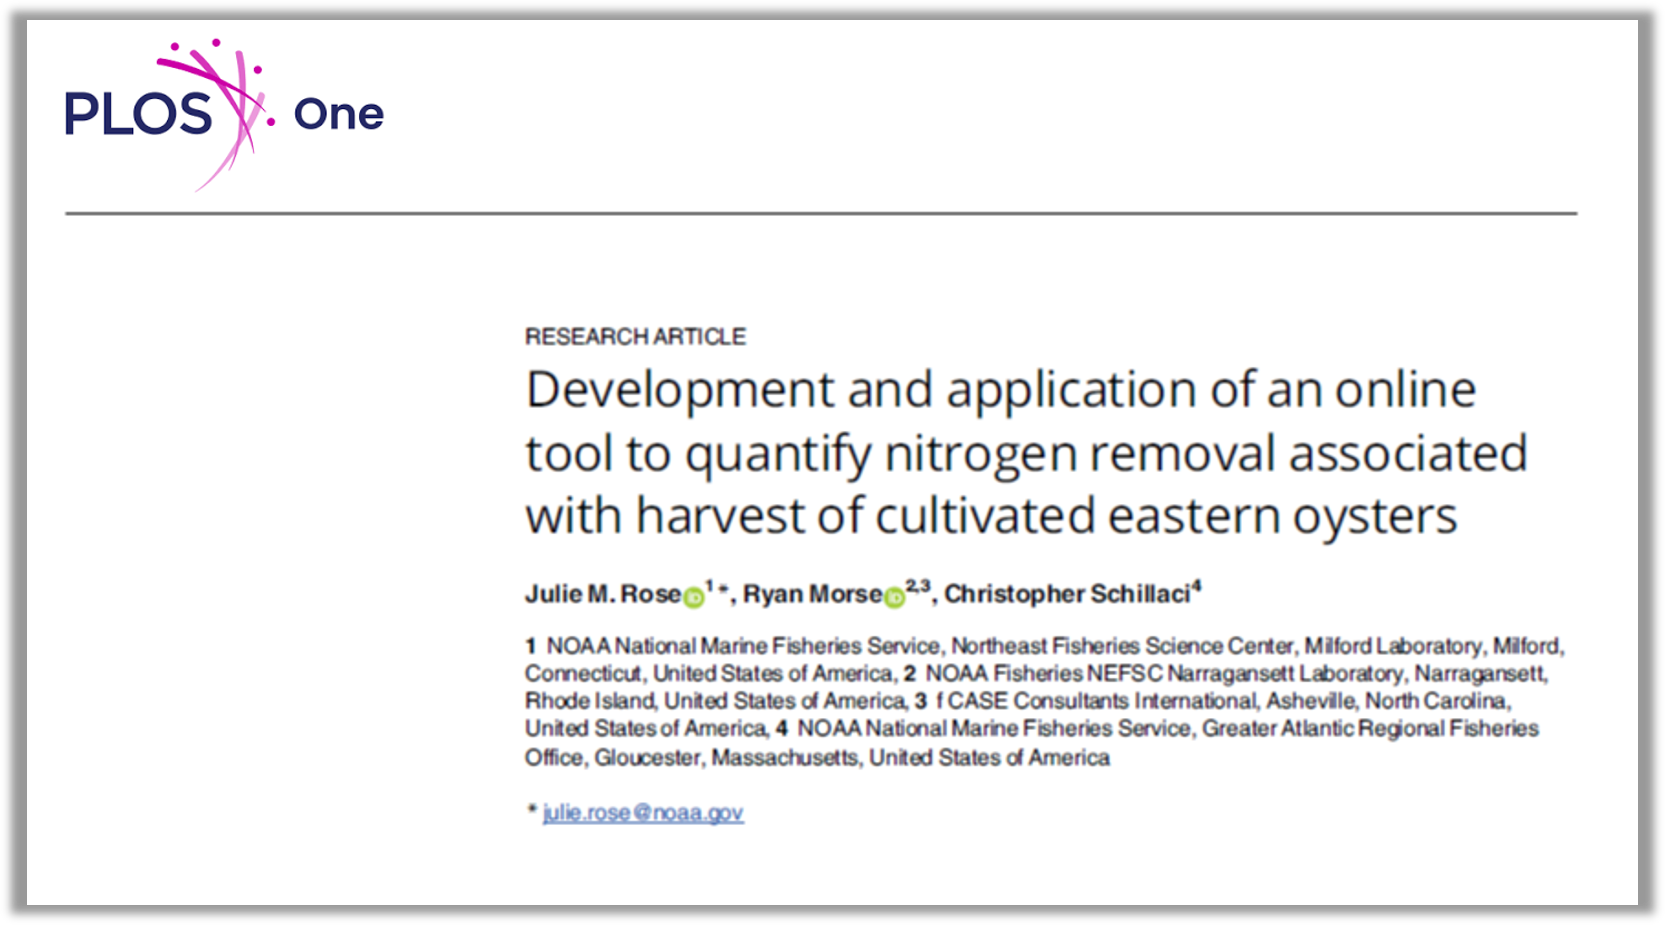
Published findings in a leading peer-reviewed journal and presented results to over 300 stakeholders via live webinars and follow-up recordings, driving tool awareness and adoption.
Worked directly with federal regulatory agencies to integrate the tool into official review processes, resulting in over 1,500 tool users to date and adoption across multiple jurisdictions.
Skills & Technologies:
R Programming | Statistical Analysis | Data Product Development | Data Transparency & Archiving | Cross-functional Collaboration | Stakeholder Engagement & Technical Communication
End-to-End Data Infrastructure & Analytics for Regulatory Intelligence
Overview:
Co-led a multi-stakeholder initiative to acquire, manage, and analyze real-world video and sensor data in support of regulatory decision-making. Oversaw the full lifecycle of data infrastructure, analysis, and tool development to translate raw observational data into actionable insights for permitting and policy processes.
Key Contributions and Outcomes:
Data Engineering: Designed and implemented a relational database to house and query time-series data from physical and observational sources, optimizing performance for future data archiving and analysis workflows.
Automated Data Processing: Developed R-based pipelines to clean and transform raw exports from specialized video analysis software, reducing time-to-insight for key regulatory questions.
Advanced Analytics & Modeling: Led the application of multivariate analysis and bootstrap-based statistical models to assess variability and trends across spatial, temporal, and categorical dimensions. Engaged in an iterative analysis process with regulators, and delivered interpretable insights to guide permit review and tool development.
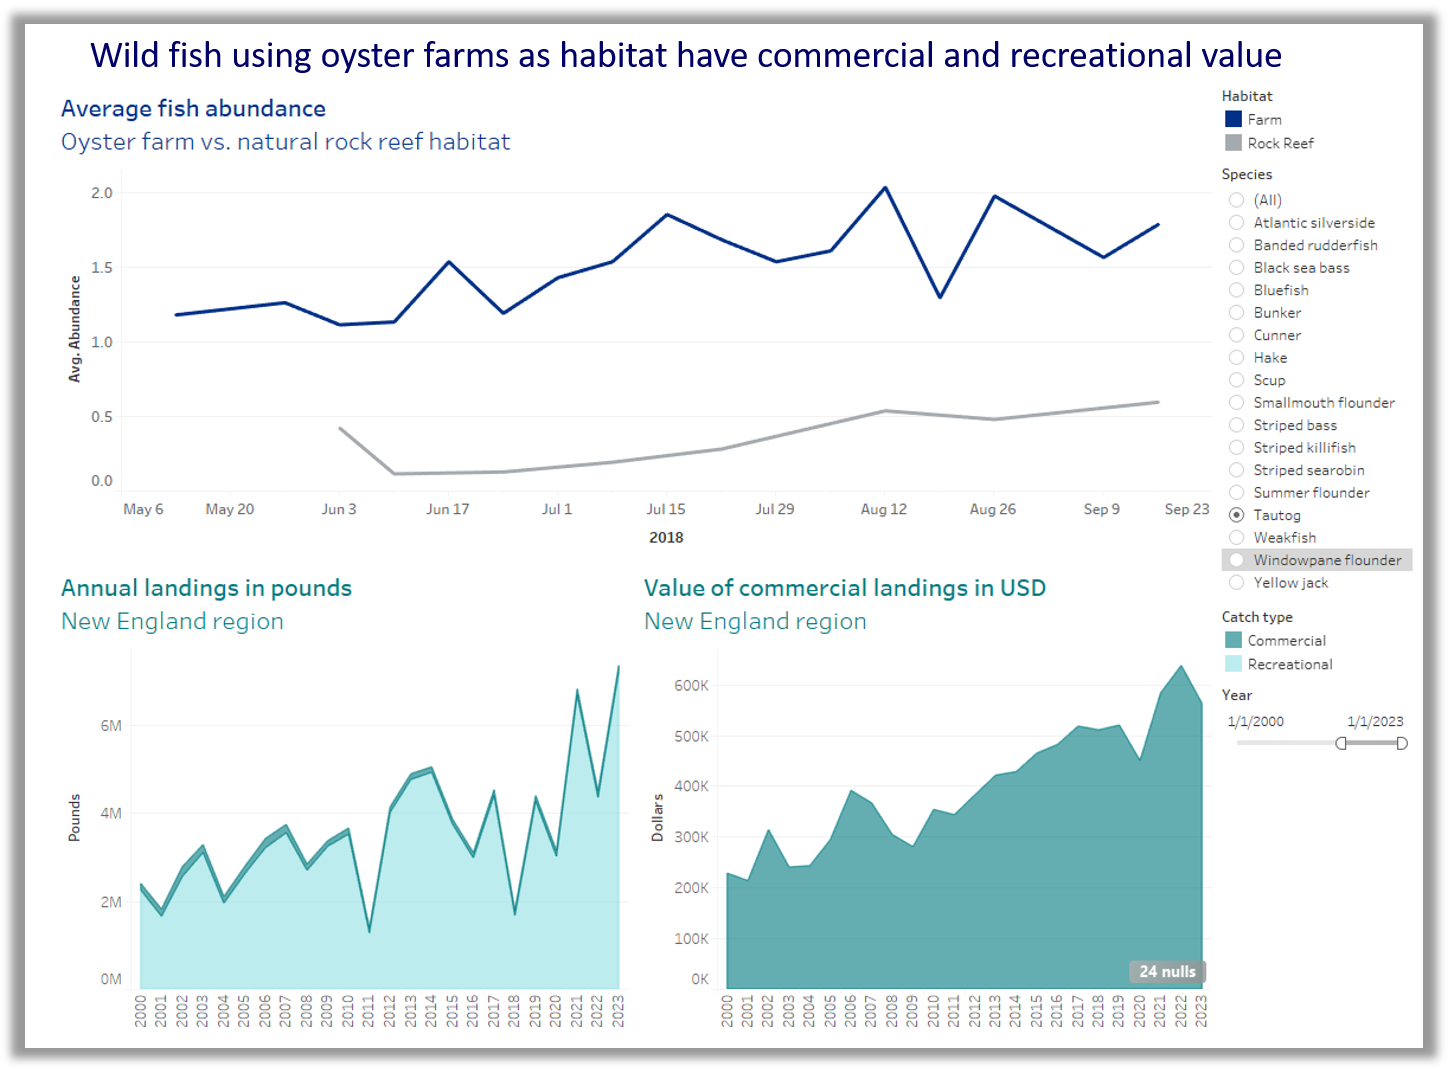
Reporting & Visualization: Created tailored visualizations and infographics to communicate findings to diverse audiences, including scientists, policymakers, and the public. Presented results to agency and congressional stakeholders.
Product Development: Supervising the development of a web-based interactive analytics tool that allows decision-makers and industry members to dynamically explore and quantify site-level metrics across multiple states and regions.
This project is influencing regulatory frameworks, expanding open data resources, and has been recognized in the media. All code is available on GitHub, and the project is featured on a dedicated website.
Skills and Technologies:
Data Infrastructure (R, Relational Databases) | Data Visualization & Communication | ETL & Automation | Statistical Modeling & Multivariate Analysis | Regulatory Collaboration | Interactive Data Tools